 |
| Bar chart Floating |
What is floating bar chart
Present of data minimum and maximum value of data sets. Mostly
this type of chart or graph are used for two or more data sets.
How to make chart
At first we need JavaScript library chart.js. This library
is open source you can download it and like with your project. There are
various chart in JavaScript that we can use. Chart with JavaScript is easy to
use and integrate with project.
Architecture of chart
This is basic chart diagram which has three component type,
data and option.
Type
Type property used to define chart type. What kind of chart
you want to use. It take string value ‘bar’ etc.
Data
This property used to set data which we want to represent. This
property further divide in component which we will discuss in next.
Options
This property use to set layout of chart. For example legend
position and scaling etc.
 |
| Bar chart |
So here we will
discuss data component
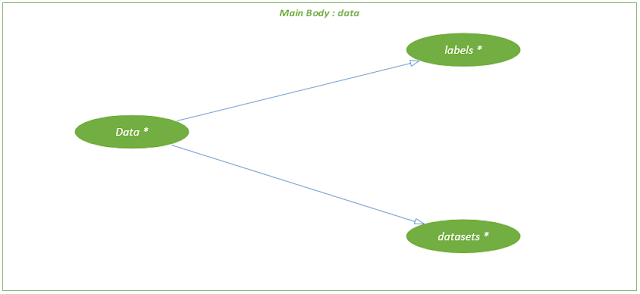
In this diagram you can see data has two properties
labels and datasets.
Labels
Label is name which we are want represent on chart. Usually label are displayed in x axis. Labels are list of label which store value in the form of string for example month name, day name etc. as shown in figure
 |
| Bar chart |
Datasets
 |
| Bar chart |
This property hold a list of dataset. It holds one or more
data sets. A data set have multiple component as you can see in figure.
These are basic component of a data set.
Label
Label are used to set name of data set. It take value in the
form of string.
Data
Data property hold list of numeric value or array of
numbers.
Background color
This property use to set background color of bar.
Border color
This property used to set color of bar’s border.
Border width
This property is used to set border size.
These properties are used for a single data set. Now we will
discuss about third component of chart option.
Option
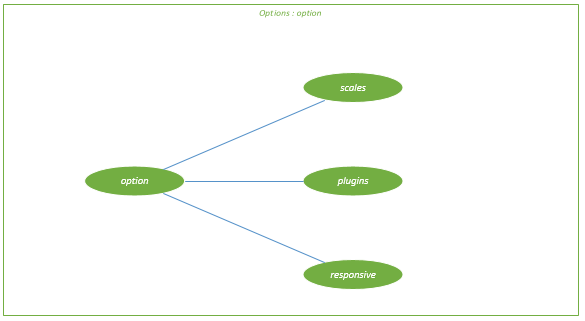
This component used to define the layout of chart. As you
can see the component of option in diagram.
 |
| Bar chart |
Options has three components scales, plugins and responsive.
Scales
 |
| Bar chart |
Scales are used to define axis minimum and maximum value. Scales
have following components.
X and y are component of scales. Both are have min and max
properties which are store value in the form of numeric. By default it adjust
its value according to data set value.
Plugins
 |
| Bar chart |
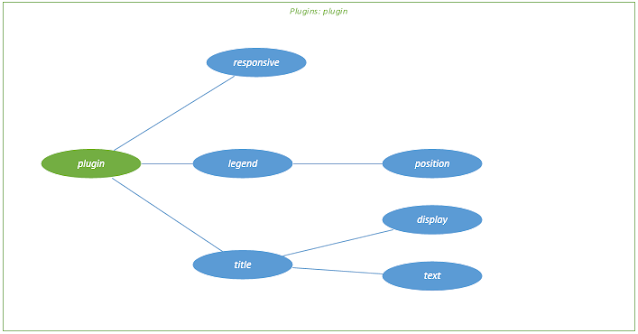
Plugin has three component responsive, legend and title. It define
the layout of chart.
Responsive
It takes Boolean value. If it is true then it’s become
responsive and vice versa.
Legend
This property used to set the position of legend it can be ‘left’,
‘right’, ‘top’, and ‘bottom’. Its take string value.
Title
This property used to display title of chart. It has two
property display which is Boolean if its true then title will display and vice
versa. Text property used to set title of chart it takes string value.
Responsive
This is a Boolean (true
or false) value to make responsive.
Code (HTML)
<!DOCTYPE html>
<html lang="en">
<head>
<meta charset="UTF-8">
<meta name="viewport" content="width=device-width,
initial-scale=1.0">
<meta http-equiv="X-UA-Compatible" content="ie=edge">
<meta name="Description" content="Enter your description here"/>
<link rel="stylesheet" href="https://cdnjs.cloudflare.com/ajax/libs/bootswatch/5.1.0/slate/bootstrap.min.css">
<link rel="stylesheet" href="https://cdnjs.cloudflare.com/ajax/libs/font-awesome/5.15.4/css/all.min.css">
<title>Bar Chart</title>
<style>
canvas{
max-width: 100%;
min-height: 500px;
max-height: 500px;
}
</style>
</head>
<body class = "bg-white m-1">
<div class="card bg-white">
<div class="card-body bg-white">
<h4 class="card-title">Bar Chart (Floating)</h4>
</div>
</div>
<div class="card bg-white m-1">
<div class="card-body">
<canvas id="floating_bar_chart"></canvas>
</div>
</div>
</body>
<script src="https://cdnjs.cloudflare.com/ajax/libs/popper.js/2.9.2/umd/popper.min.js"></script>
<script src="https://cdnjs.cloudflare.com/ajax/libs/twitter-bootstrap/5.1.0/js/bootstrap.min.js"></script>
<script src="../../chart.js/dist/chart.min.js"></script>
<script src="../../Css/background_color.js"></script>
<script src="floating bar chart.js"></script>
</html>
Code (JavaScript)
var floating_bar_chart = document.getElementById('floating_bar_chart');
var labels = [
'Grade 1', 'Grade 2','Grade 3', 'Grade 4','Grade 5', 'Grade 6'
];
var dataset1 = {
label: 'Data 1',
data: [12, 19, 3, 5, 2, 3],
backgroundColor: BG_19CX8I,
borderColor: BG_19CX7I,
borderWidth: 1,
}
var dataset2 = {
label: 'Data 2',
data: [-11, -28, 22, -25, 22, -13],
backgroundColor: BG_19CX9I,
borderColor: BG_19CX7I,
borderWidth: 1,
}
var data =
{
labels: labels,
datasets: [dataset1,dataset2]
}
var scale = {
x:
{
//min : 0,
//max: 50,
},
y:
{
//min : 0,
//max: 50,
}
}
var legend ={
position: 'right',
}
var title = {
display: true,
text: 'Floating Bar Chart'
}
var plugin =
{
responsive: true,
legend: legend,
title: title
}
var option =
{
scales: scale,
plugins: plugin,
responsive: true,
}
var barchart = new Chart(floating_bar_chart,
{
//chart type
type: 'bar',
//assign Data
data: data,
//chart style
options: option
}
);
Outcome
 |
| Bar chart |

0 Comments